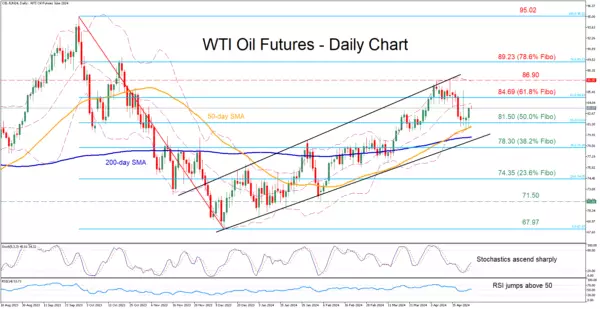
When considering the trends exhibited by WTI oil futures, it is clear that a bullish channel has been maintained since December. This bullish trend has been evident since the price reached a low of 69.97 and surged to a six-month high of 86.90 on April 12. Despite a recent pullback from this peak, the price found support at the 50-day simple moving average (SMA), indicating a potential continuation of the bullish trend.
Support and Resistance Levels
In terms of potential price movement, immediate resistance is likely to be encountered at 84.69, which represents the 61.8% Fibonacci retracement level of the downward move from 95.02 to 67.97. Breaking above this level could pave the way for a test of the recent six-month high at 86.90. Further upward momentum may face resistance at the 78.6% Fibonacci level of 89.23. On the other hand, if bearish pressure intensifies, the price could drop to the 50.0% Fibonacci level of 81.50. Below this level, support may be found at the 38.2% Fibonacci level of 78.30, with a potential further decline to the 23.6% Fibonacci level of 74.35.
Momentum Indicators
Despite the recent setback in WTI futures, momentum indicators suggest that positive momentum is intensifying. This is evident from the price’s swift recovery after bouncing off the 50-day SMA. As a result, the most likely scenario is a continuation of the recent rebound, with momentum indicators favoring further upside potential.
The analysis of WTI oil futures trends indicates a strong bullish bias, with support levels holding firm and resistance levels being tested. While some short-term fluctuations may occur, the overall momentum remains tilted to the upside. Traders and investors should monitor key Fibonacci levels and the 50-day SMA for potential entry and exit points in line with the prevailing trend.
Leave a Reply